Project 01
Financial Performance Tracking
An interactive Power BI solution designed to evaluate financial performance, analyze revenue and profitability trends, and support data-driven decision-making.
Overview
To evaluate financial performance, analyze revenue and profitability trends, and develop a condensed income statement to support data-driven decision-making.
2 interactive Power BI dashboards covering financial performance, profitability, and sales analysis.
Process
Analyzed the Excel dataset to understand its structure, key attributes, and business requirements.
Used Power Query to clean, transform, and prepare the data for analysis.
Built relationships between tables to create an efficient data model.
Developed DAX measures to calculate key financial KPIs and profitability metrics.
Designed two interactive Power BI dashboards for financial and sales performance monitoring.
Dashboards
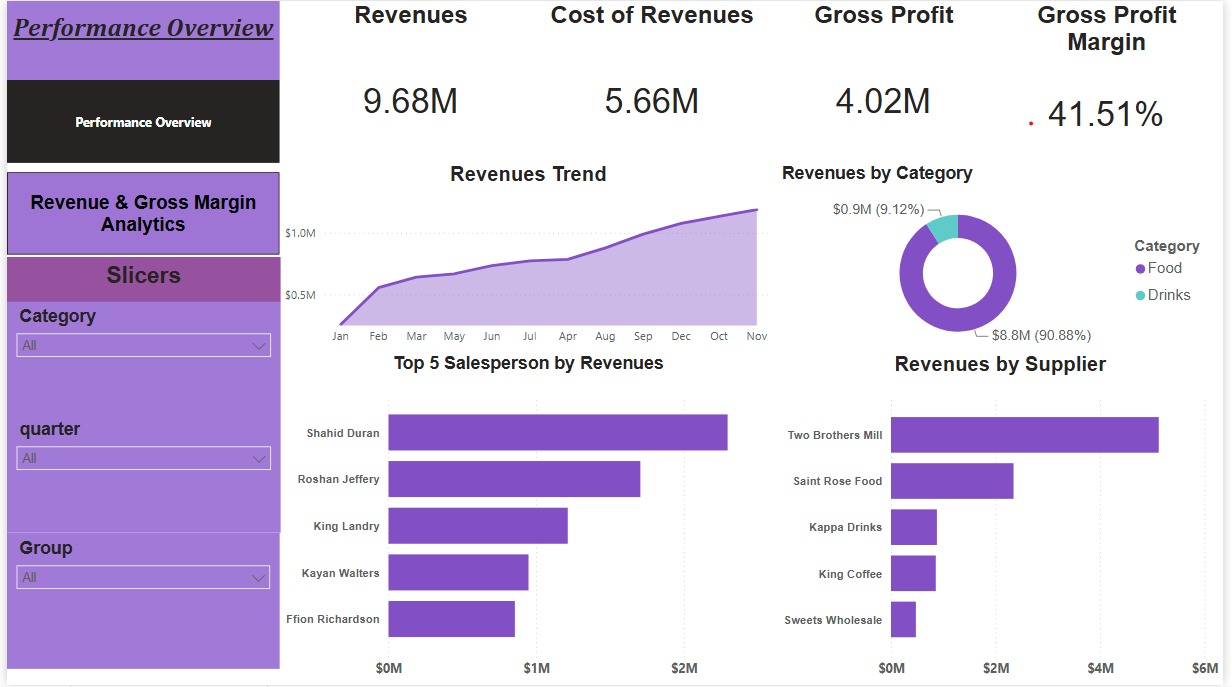
Provides a financial overview of the business through key profitability indicators and performance trends.
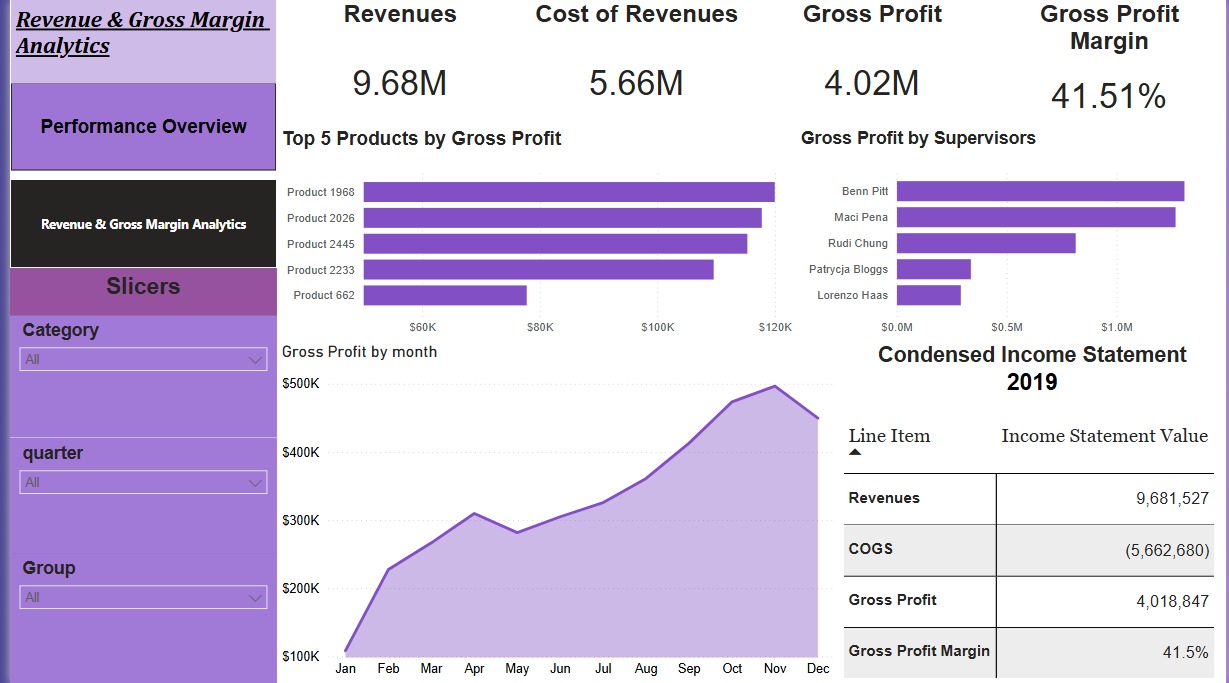
Presents revenue trends, category performance, salesperson performance, and supplier analysis.
Analysis