Project 02
An interactive Power BI solution designed to analyze overall sales performance, evaluate sales representative productivity, assess product and customer trends, and monitor returns to identify key business drivers and operational opportunities.
Overview
To analyze overall sales performance, evaluate sales representative productivity, assess product and customer trends, and monitor returns to identify key business drivers and operational opportunities.
3 interactive Power BI dashboards covering executive, operational, and detailed performance analysis.
Process
Examined the Excel dataset to understand its structure, relationships, and key business metrics.
Used Power Query to clean, transform, and prepare the data for analysis.
Built a data model connecting sales transactions, customers, products, sales representatives, and regions.
Developed DAX measures for revenue, orders, return rates, average order value, and sales representative performance.
Designed three interactive dashboards covering executive, operational, and detailed performance analysis.
Dashboards
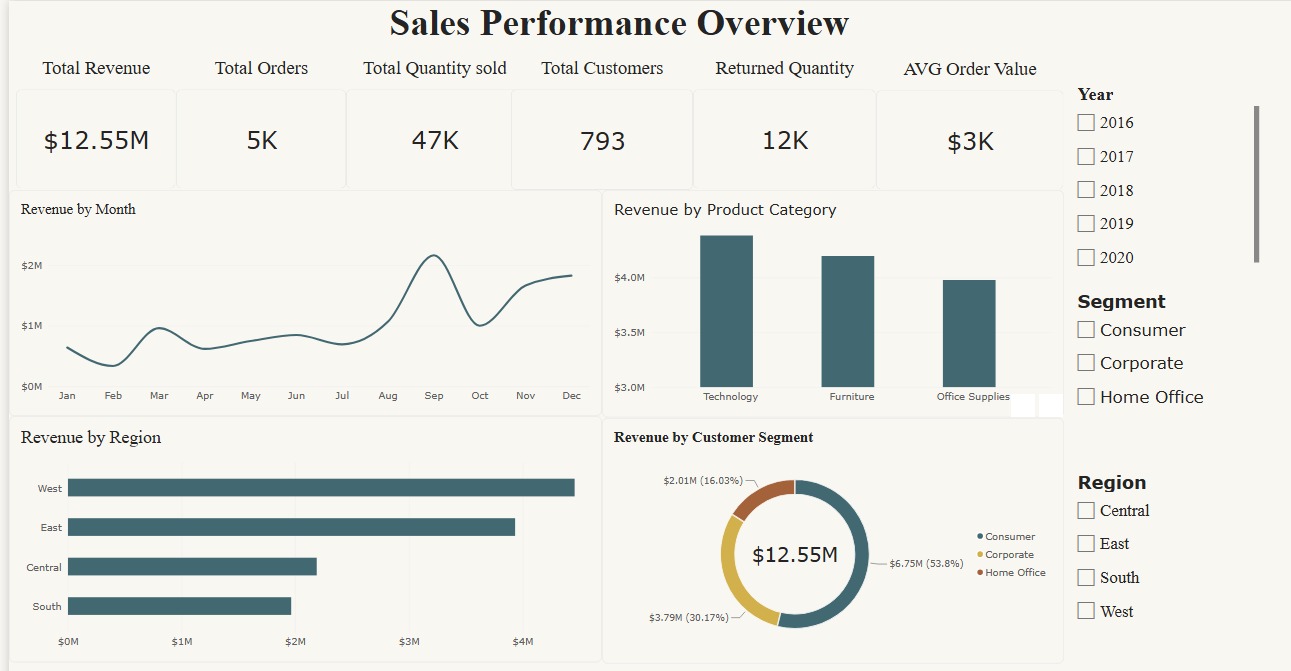
Provides an executive overview of sales performance through key revenue, order, customer, quantity, and return metrics, along with major sales trends and business dimensions.
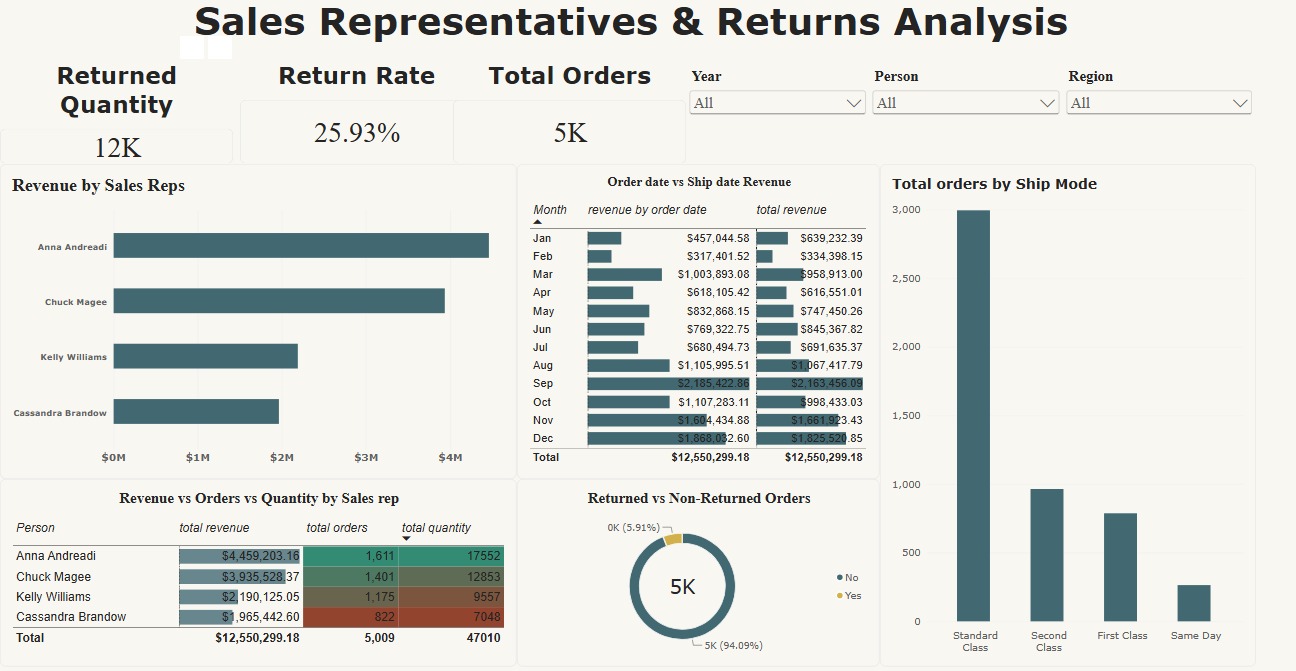
Analyzes sales representative performance, return rates, returned versus non-returned orders, shipping modes, and revenue by order and ship date.
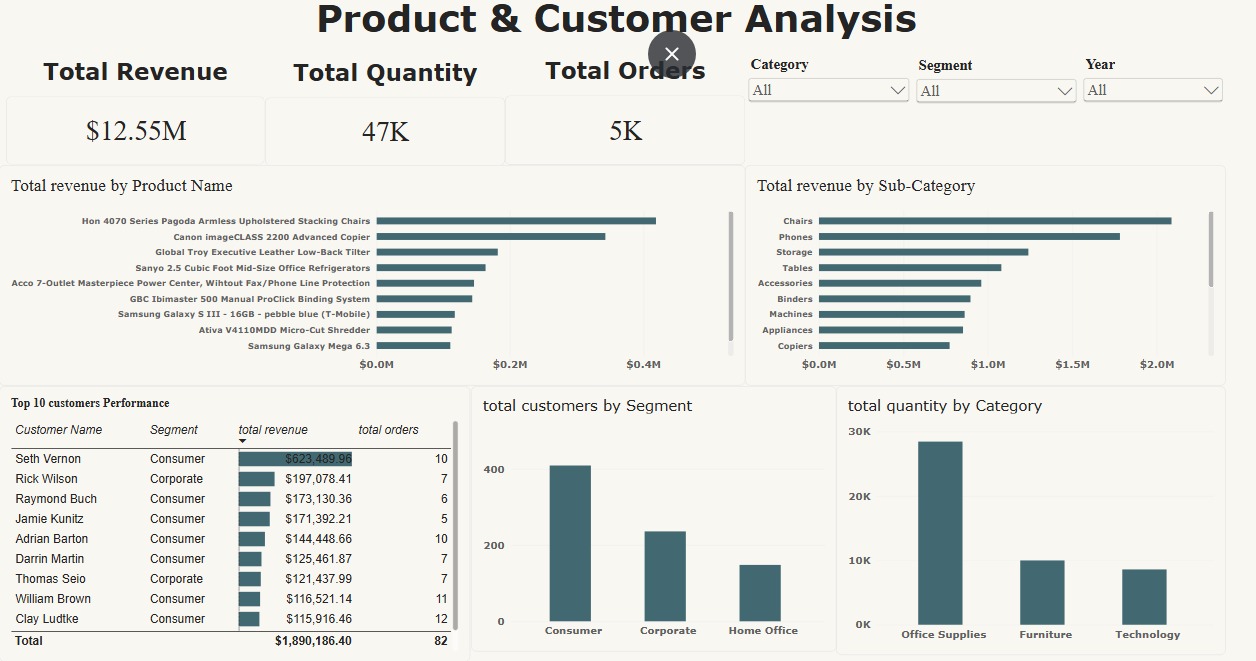
Provides detailed analysis of top products, sub-categories, customers, customer segments, and quantity sold across product categories.
Analysis